Visualizing Project Progress: A Multi-View Approach
The Danger of the Single Perspective
In the world of project management, there is a common trap: falling in love with a single tool. A dedicated Gantt chart enthusiast might spend hours perfecting dependencies but lose sight of the fact that the team is overwhelmed. A Kanban purist might have a perfectly flowing board but fail to notice that they are three weeks behind on a critical deadline. Both of these pitfalls stem from the same problem: a lack of perspective. By only looking at your project from one angle, you develop 'blind spots' that can eventually derail even the best-laid plans.
This is why we've built a truly multi-view platform. We believe that professional project management requires the ability to switch mental models instantly. You need to be able to see the Forest (the Gantt chart), the Trees (the Kanban board), and the Seedlings (the Noteboard). This post explores the strategic benefits of a multi-view approach and how it can help you spot risks earlier, manage resources better, and communicate more effectively with your stakeholders.
The Macro View: Navigating the Forest
The Gantt chart is your strategic map. It tells you where you are, where you're going, and how long it's going to take to get there. Its greatest strength is its ability to show relationships. You can see how a delay in the 'API Development' phase will ripple through the 'Frontend Integration' and 'User Testing' phases. This high-level visibility is essential for managing expectations with clients and executives. It answers the big questions: 'When will we be done?' and 'Are we on schedule?'
However, the Gantt chart's weakness is its abstraction. It treats a week-long task as a single bar, hiding the day-to-day struggles and successes of the team. If you only look at the Gantt chart, you might think everything is fine because the bar hasn't turned red yet, even if the team is working 14-hour days just to keep up. You need a different view to see the reality of the work.
The Micro View: Inspecting the Trees
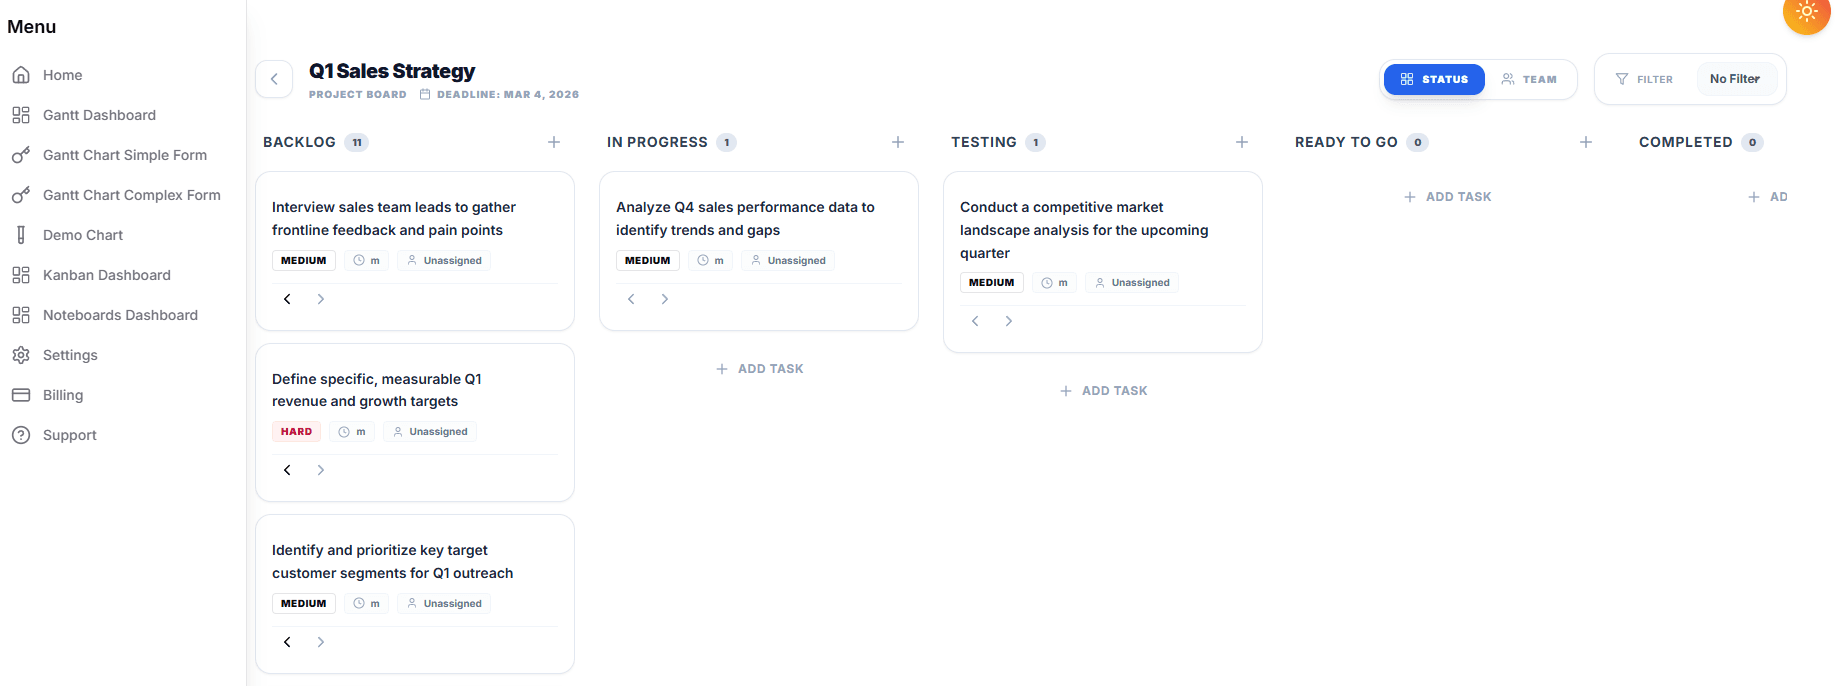
The Kanban board is your operational dashboard. It shows you the 'Flow' of work. While the Gantt chart tells you when a task should be done, the Kanban board tells you what is actually happening right now. It reveals the 'Work in Progress' (WIP) and highlights the bottlenecks that a Gantt chart often obscures. Is the 'Quality Assurance' column overflowing? That’s a bottleneck that needs attention, regardless of what the overall schedule says.
By switching to the Kanban view, you can have more productive conversations with your team. Instead of asking 'Is it done yet?', you can ask 'What is blocking this card from moving to the next column?'. It shifts the focus from 'Deadlines' to 'Delivery'. It allows you to see the workload of individual team members and redistribute tasks before someone reaches their breaking point. It's the 'human' side of project management.
The Synthesis View: Planting the Seedlings
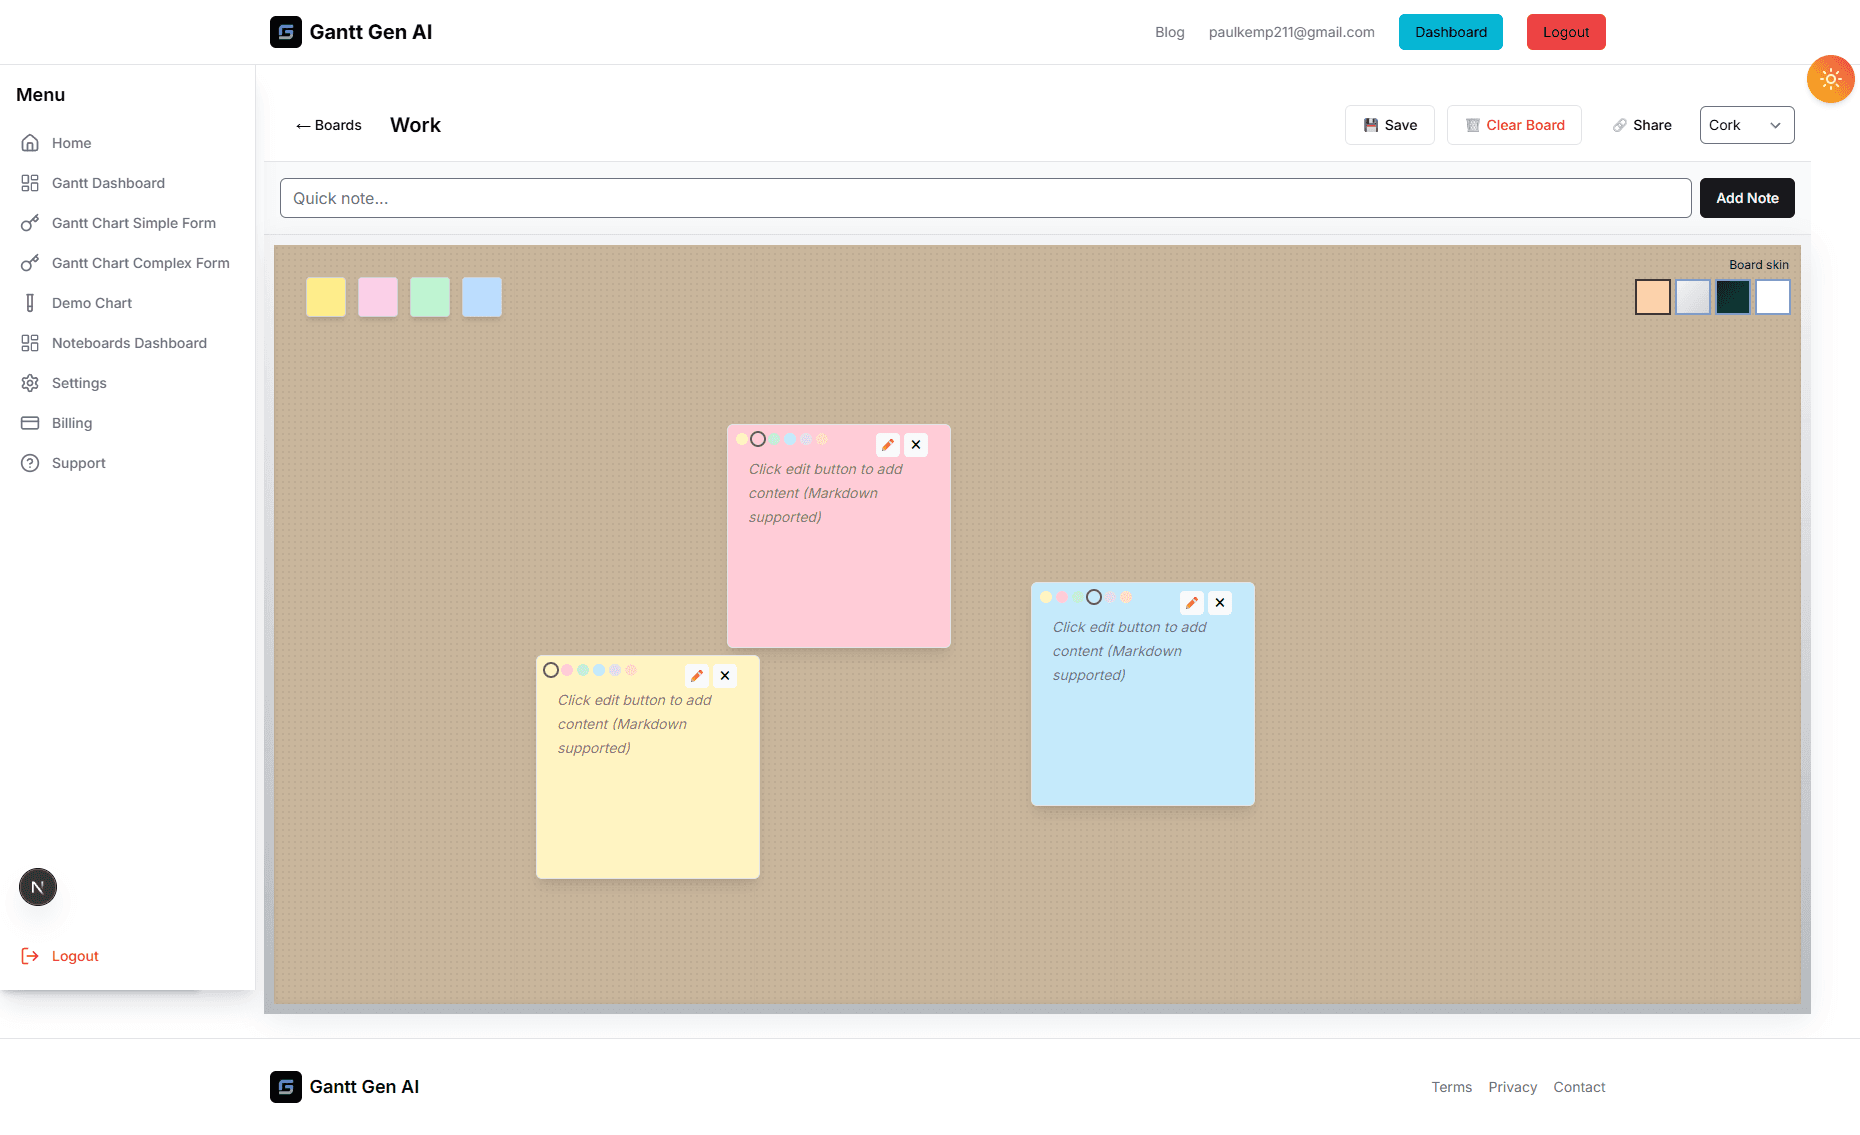
Finally, the Noteboard provides the 'Context' view. It’s where the original vision, the research, and the creative discussions live. When you're deep in the weeds of execution, it’s easy to lose sight of why you're doing a task in a certain way. By keeping your Noteboards integrated into your workflow, you can quickly jump back and review the original client brief or the brainstorming notes from three months ago. It ensures that the project's 'North Star' remains visible through every stage of development.
How to Use Multiple Views Strategically
The most effective project managers use these views in a specific rhythm. Here is a recommended routine to maximize your visibility:
- Monday Morning (The Macro Check): Start the week in the Gantt chart. Review the upcoming milestones and ensure the high-level plan is still sound.
- Daily Stand-ups (The Micro Check): Use the Kanban board for your daily check-ins. Focus on moving cards and identifying immediate blockers.
- Wednesday Deep Dive (The Context Check): Revisit the Noteboard. Are the tasks we're working on still aligned with the original brainstorming goals? Do we need to capture any new ideas that have emerged?
- Friday Review (The Progress Check): Look at the Gantt chart again. Update the progress based on the cards moved to 'Done' this week and adjust the future timeline if necessary.
Communication is Key
Different stakeholders need different views. Your developers will spend 90% of their time in the Kanban board. Your project sponsors will likely only care about the Gantt chart's milestones. Your creative team might live in the Noteboards. By having all these views in one platform, you can give everyone the information they need in the format they prefer, without any extra work. You aren't just managing a project; you're facilitating a shared understanding across the entire organization. That is the true power of a multi-view approach.